Difference between revisions of "DevGuide/GDB OpenOCD Debug"
m (NeoFromMatrix moved page DevGuide/JTAG-Debug to DevGuide/GDB-Debug: also SWD and not just JTAG compatible, GDB covers the text on the page nice) |
|||
| Line 1: | Line 1: | ||
== JTAG | ===JTAG Adapters=== | ||
'''TODO: Merge to [[Programming_adapter]]''' | |||
There are multiple Paparazzi-compatible devices available that support JTAG. | |||
====[[Programming_adapter#FLOSS_JTAG|FLOSS JTAG]]==== | |||
The FLOSS JTAG is based on an FTDI chip that allows two simultaneous USB connections, which means that FLOSS JTAG allows JTAG and UART/COM connections. | |||
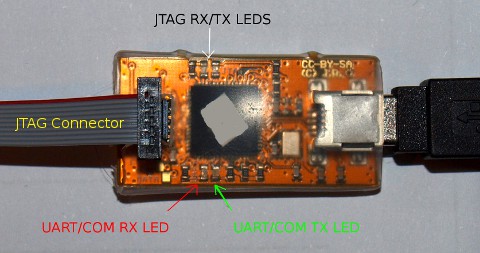
Let's take a look at upper side of the board. It contains JTAG connector (which is connected on photo) and two sets of RX/TX LEDs for JTAG and UART/COM interface separately. The JTAG connector is 2x5 pins, 0.05-inch pitch, and is compatible with the Samtec FFSD-05-D-06.00-01-N-RW-R ribbon cable. | |||
[[Image:Jtag-up.jpg]] | |||
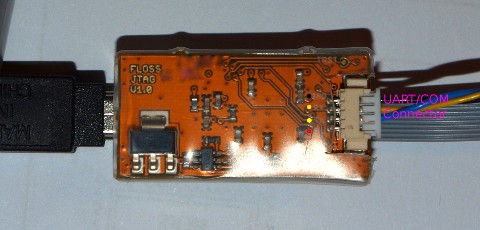
On the other side of the board there is 4 pin UART/COM connector, which contains (from top to bottom in the image below): Ground (black), RX (orange), TX (yellow), and +5V (red) | |||
[[Image:Jtag-down.jpg]] | |||
Usage of board is pretty simple: JTAG can be used to upload firmware into the board and/or repair board with broken bootloader, and UART/COM interfaced can be used to make "COM port style" connection to the board. COM connection can be used for example for telemetry debug. | |||
More info available on the [http://randomprojects.org/wiki/Floss-JTAG randomprojects.org wiki]. | |||
====[[Programming_adapter#Black_Magic_Probe|Black Magic Probe]]==== | |||
[[Image:BMPM_1_top.jpg|500x500px]][[Image:BMPM_1_bottom.jpg|500x500px]] | |||
Some additional info about the Black Magic Probe is available at the [http://www.blacksphere.co.nz/main/blackmagic Black Sphere Technology website]. | |||
To use Black Magic Probe instead of FLOSS-JTAG or Luftboot for firmware flashing, append the following string to the upload command: | |||
On Linux: | |||
FLASH_MODE=JTAG_BMP BMP_PORT=/dev/ttyACM0 | |||
On Mac OS: | |||
FLASH_MODE=JTAG_BMP BMP_PORT=/dev/cu.usbmodem<serial> | |||
To make this the default flash method add this in the airframe file firmware section: | |||
<configure name="FLASH_MODE" value="JTAG_BMP"/> | |||
<configure name="BMP_PORT" value="/dev/ttyACM0"/> | |||
See the [[FirmwareFlashing]] page for other methods. | |||
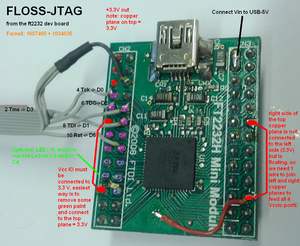
==== FT2232H Mini Module ==== | |||
Use ftdi prog to change the Description String into: FLOSS-JTAG. <br/> | |||
More information for this board at [[Serial_Adapter]]. | |||
[[File:AlternativeFlossJtag.png|300px]] | |||
== Debugging with GDB over JTAG == | == Debugging with GDB over JTAG == | ||
=== Procedure === | === Procedure === | ||
# Start openocd in a new shell since this process needs to remain running. | # Start openocd in a new shell since this process needs to remain running. | ||
#* STM targets | #* STM targets | ||
| Line 38: | Line 84: | ||
#:<pre>continue</pre> | #:<pre>continue</pre> | ||
== Black Magic Probe == | |||
# Start GDB for arm | # Start GDB for arm | ||
#: Open GDB with the correct binary file | #: Open GDB with the correct binary file | ||
Revision as of 14:44, 30 March 2015
JTAG Adapters
TODO: Merge to Programming_adapter
There are multiple Paparazzi-compatible devices available that support JTAG.
FLOSS JTAG
The FLOSS JTAG is based on an FTDI chip that allows two simultaneous USB connections, which means that FLOSS JTAG allows JTAG and UART/COM connections.
Let's take a look at upper side of the board. It contains JTAG connector (which is connected on photo) and two sets of RX/TX LEDs for JTAG and UART/COM interface separately. The JTAG connector is 2x5 pins, 0.05-inch pitch, and is compatible with the Samtec FFSD-05-D-06.00-01-N-RW-R ribbon cable.
On the other side of the board there is 4 pin UART/COM connector, which contains (from top to bottom in the image below): Ground (black), RX (orange), TX (yellow), and +5V (red)
Usage of board is pretty simple: JTAG can be used to upload firmware into the board and/or repair board with broken bootloader, and UART/COM interfaced can be used to make "COM port style" connection to the board. COM connection can be used for example for telemetry debug.
More info available on the randomprojects.org wiki.
Black Magic Probe
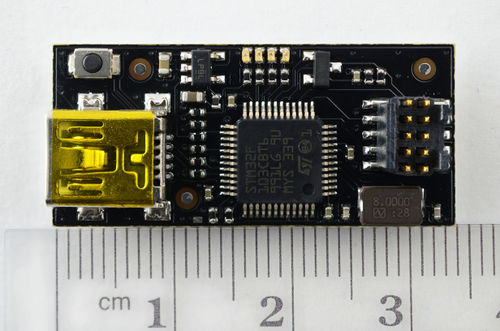
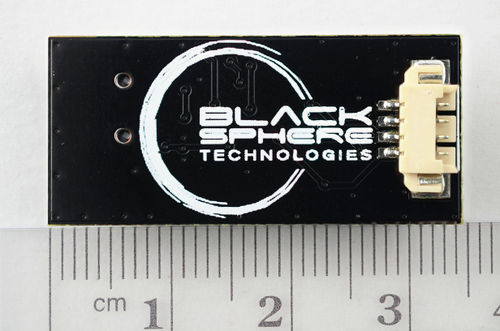
Some additional info about the Black Magic Probe is available at the Black Sphere Technology website.
To use Black Magic Probe instead of FLOSS-JTAG or Luftboot for firmware flashing, append the following string to the upload command:
On Linux:
FLASH_MODE=JTAG_BMP BMP_PORT=/dev/ttyACM0
On Mac OS:
FLASH_MODE=JTAG_BMP BMP_PORT=/dev/cu.usbmodem<serial>
To make this the default flash method add this in the airframe file firmware section:
   <configure name="FLASH_MODE" value="JTAG_BMP"/>
   <configure name="BMP_PORT" value="/dev/ttyACM0"/>
See the FirmwareFlashing page for other methods.
FT2232H Mini Module
Use ftdi prog to change the Description String into: FLOSS-JTAG.
More information for this board at Serial_Adapter.
Debugging with GDB over JTAG
Procedure
- Start openocd in a new shell since this process needs to remain running.
- STM targets
- To connect to the Lisa/L board run the command
openocd -f interface/lisa-l.cfg -f board/lisa-l.cfg
- To connect to the Lisa/M board via FLOSS-JTAG run the command:
openocd -f interface/flossjtag.cfg -f board/lisa-l.cfg
- NXP LPC targets
- To connect to the LPC based board via OLIMEX ARM-USB-OCD dongle run the command:
openocd -f interface/olimex-arm-usb-ocd.cfg -f target/lpc2148.cfg
- To connect to the LPC based board via OLIMEX ARM-USB-OCD-H dongle run the command:
openocd -f interface/olimex-arm-usb-ocd-h.cfg -f target/lpc2148.cfg
- Compiler Debug Options
- On LPC target build your ap file with debug options. See https://github.com/elemhsb/paparazzi/blob/v4.0/conf/Makefile.lpc21 .
- Start GDB with an argument of the elf file created and uploaded to the board.
- If you programmed with the ap target then the command would be along the lines of
/opt/paparazzi/arm-multilib/bin/arm-none-eabi-gdb var/<airframe>/ap/ap.elf
- Replace <airframe> with the name of the airframe that has been built.
- Now connect GDB to the board
target remote localhost:3333
- Now we need to set some break points in the code.
- In this example the ap target was part of the rotorcraft and main.c contains the main program. Open rotorcraft sw/airborne/firmwares/rotorcraft/main.c and find a line at which you'd like to set a break point.
break main.c:113
- Stop the currently running code
monitor reset halt
- Reset the code back to the start
monitor reset init
- Now we can run the program which will stop at the break point we set.
continue
Black Magic Probe
- Start GDB for arm
- Open GDB with the correct binary file
/opt/paparazzi/arm-multilib/bin/arm-none-eabi-gdb ./var/AIRFRAME/ap/ap.elf
- Set Black Magic Probe as Target over the serial link (see ls /dev/ttyACM*):
target extended-remote /dev/ttyACM0
- Probe via JTAG to get a list of devices:
mon jtag_scan
- (for Lisa/S, use swdp_scan instead of jtag_scan)
- Attach to a device:
attach 1
- Happy Debugging!
-this information was merged from: --ht tp :// sourceforge. net/apps/mediawiki/blackmagicdebug/index.php?title=Main_Page --JTAG
Useful commands
- We probably want to ignore the interrupt calls for the moment so we can step through the code as it's being called. Note that we don't always want to do this. (STM32 command only)
monitor cortex_m3 maskisr on
- A stack trace can be printed with the command
bt
- show the variable of a variable
print i2c1.status
- Show (eXamine) the value of the 9 bytes hardware register at address 0x40005800 and show them in hex format:
x/9x 0x40005800
- In some cases you may not be able to access some memory areas in the mcu, in that case you should try:
set mem inaccessible-by-default off
Commands can often be issued without typing the entire command. Here are some commonly used commands; many of them can be invoked using only the first letter:
(gdb) quit – exit the debugger
(gdb) file – load an executable file
(gdb) break line-number/function name -- Set a break-point on a line/at start of function
(gdb) run <args> -- start running the program; if there are command-line arguments, put them after the run invocation
(gdb) cont -- continue running, after a break
(gdb) next -- Next program line (step over function calls)
(gdb) step -- Step into function calls.
(gdb) finish - Step out of the present function
(gdb) print expression -- Show value of a variable or expression
(gdb) list – List 10 lines of the program being debugged. The sixth line is the preset statement. Subsequent, consecutive entry of list will list the next 10 lines.
(gdb) where – obtain a backtrace showing all function calls before the current statement
(gdb) up – Move to the function that called the present function. Useful if your program crashes in a library function; use up to get to the last function call in your program
(gdb) down – Reverses the action of up
(gdb) delete – Removes breakpoint by number (see example following). If no number, all deleted.
(gdb) kill – Terminates the program.
Setting up .gdbinit for BMP and gdb-regview
If you use gdb just with a BMP, you can set some initialization commands in ~/.gdbinit that will run when gdb is started, improving workflow.
A very useful plug-in called gdb-regview (available on GitHub) can really speedup debugging stm32 processors by providing a pretty-printed summary of register contents.
A sample file for debugging Lisa/M 2.0 would be:
set target-async on
set mem inaccessible-by-default off
#for gdb-regview plugin
source /path/to/gdb-regview/gdb-regview.py
regview load /path/to/gdb-regview/defs/STM32F10X_CL.xml
tar ext /dev/BMP_DEVICE
mon version
mon swdp_scan
att 1
This should be saved in ~/.gdbinit.
Then, after one starts gdb as described above, you can view registers easily, for example:
(gdb) regview show ADC_CR1
Easily load new binaries from inside gdb with BMP
It is also easy to rebuild and reload a program from inside gdb. Calling make from the gdb command line will call make in your current directory:
(gdb) make
To load a new elf file into gdb after compiling elsewhere (only required when changing the name of the file):
(gdb) file file_name.elf
To upload the binary as per the currently loaded elf:
(gdb) load
This assumes you have attached to the target already (as per the .gdbinit example just above).
To restart the program from the beginning:
(gdb) run
and enter y.
gdb should detect that the elf has changed when loading the new binary, so if the file name has not changed, one should just be able to rebuild (make from inside gdb if appropriate) and then call load and run.
