Difference between revisions of "CricketProbe/v1.00"
Jump to navigation
Jump to search
| Line 1: | Line 1: | ||
The CricketProbe is a debugging tool for | The CricketProbe is a debugging tool for ARM Cortex Microprocessors.<br> | ||
It is a | It is a [http://http://www.blacksphere.co.nz Black Sphere Technologies] [http://http://www.blacksphere.co.nz/main/blackmagic Black Magic Probe] PCB re-design, with some improvements made to the connectors, and is fully software-compatible.<br> | ||
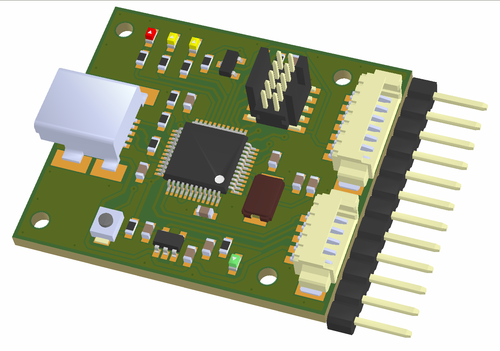
[[Image:CricketProbe_v100_3D_top.png|right|500px|CricketProbe v1.00 3D top view]] | [[Image:CricketProbe_v100_3D_top.png|right|500px|CricketProbe v1.00 3D top view]] | ||
Revision as of 15:39, 19 April 2014
The CricketProbe is a debugging tool for ARM Cortex Microprocessors.
It is a Black Sphere Technologies Black Magic Probe PCB re-design, with some improvements made to the connectors, and is fully software-compatible.
Hardware Revision History
| Version # | Release Date | Release Notes |
|---|---|---|
| v1.00 (current) | 04/2014 | Initial release |
| v0.00 | 02/2014 | Prototype |
Detailed Features
Fully compatible with the Black Magic Probe, the features are identical:
(following is a copy of Black Magic Probe's webpage)
- Aimed at ARM Cortex based microcontrollers.
- Allows direct connection to the targeted processors JTAG interface. Alternatively, you may use the ARM Serial Wire Debug protocol as well.
- Full debugging functionality is provided. This includes: watchpoints, flash memory breakpoints, memory and register examination, flash memory programming, etc.
- Multiple targets on a single JTAG scan chain is supported.
- Interface to the host computer is a standard USB CDC ACM device (a virtual serial port), which does not require special drivers on Linux.
- Implements the GDB extended remote debugging protocol for seamless integration with the GNU debugger and other GNU development tools.
- Implements USB DFU class for easy firmware upgrades (as updates become available).
- Windows, Linux and Mac environments supported.
This board allows you to:
- Load your application into the target processor Flash memory or RAM.
- Single step through your program.
- Run your program in real-time with halt on demand.
- Examine and modify CPU registers and memory.
- Obtain a call stack backtrace.
- Set up to 6 hardware assisted breakpoints.
- Set up to 4 hardware assisted read, write or access watchpoints.
- Set unlimited software breakpoints when executing your application from RAM.
Pictures
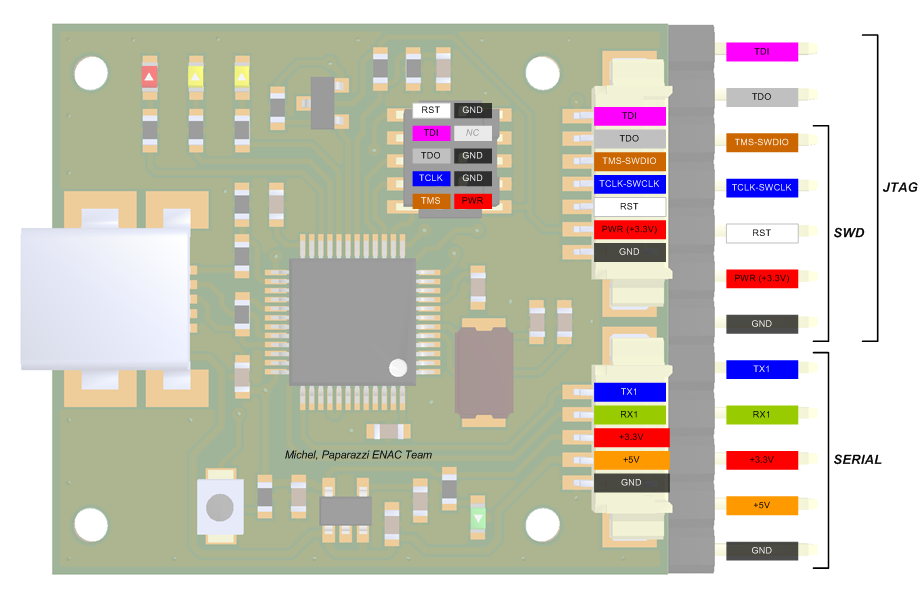
Pinout
Pins Name and Type are specified with respect to the CricketProbe Board
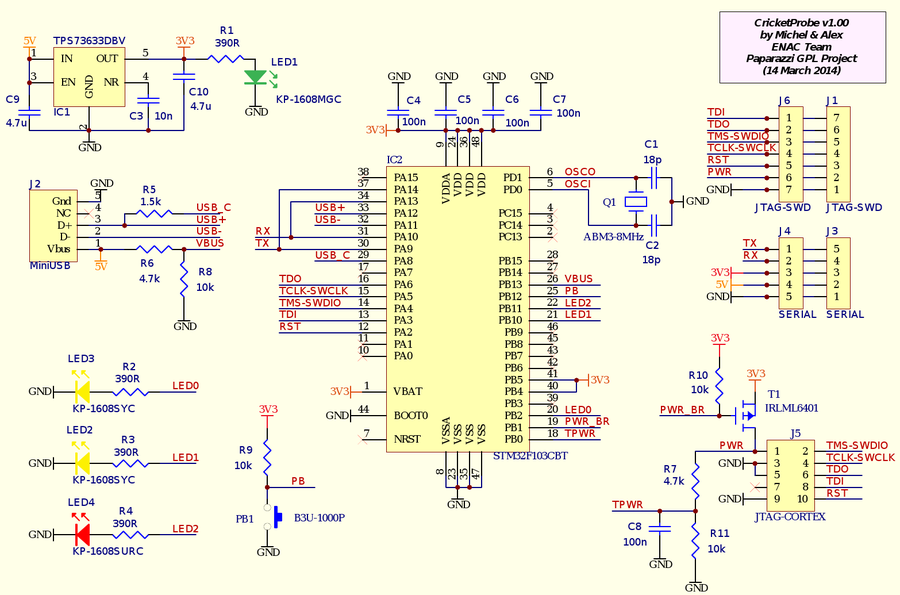
Schematic
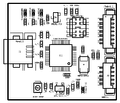
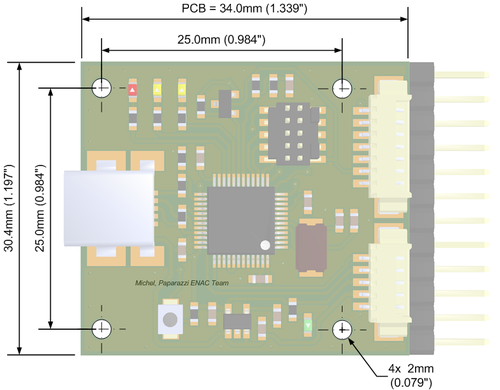
PCB
Gerber & Drill Files
Assembly
Components Layout
Bill Of Material
Download CricketProbe v1.00 Bill of Material (zipped .xls file)
PCB and assembled boards suppliers
Check availability on Get Hardware page
